|
APPENDIX B
Imbalances in the Economy
The purpose of this
Appendix is to seek answers to four questions:
- How do structural economic imbalances
manifest themselves?
- Has
bank-money (specifically, bank loans) been misdirected or misallocated at
the top banks?
- Is
there empirical evidence to corroborate "tacit collusion" or "conscious
parallelism" at top banks?
- Is
there empirical evidence to corroborate the occurrence of a "credit crunch" at
top banks?
|
|
STRUCTURAL IMBALANCES IN THE ECONOMY
ROYAL
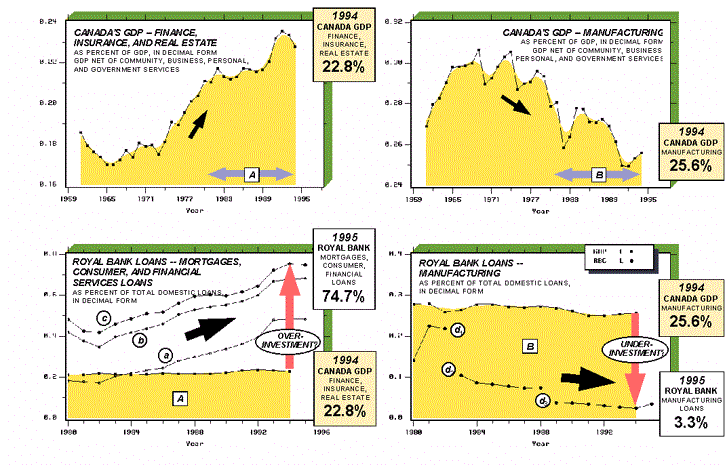
BANK DOMESTIC LOANS VS. CANADA'S GDP |

LEGEND |
GDP
curves (top and bottom rows) |
| A |
finance, insurance, and real estate (top row:
1961-1994; bottom row: 1980-1994) |
| B |
manufacturing (top row: 1961-1994; bottom row:
1980-1994). |
| Royal Bank curves (bottom
row) |
| a |
total mortgages + commercial real estate loans |
| b |
a + consumer instalment,
credit card, and other personal loans |
| c |
b + financial institutions
loans. |
| d1 |
manufacturing, 1980-1982 |
| d2 |
manufacturing, 1983-1988 |
| d3 |
manufacturing, 1989-1995. |
|
|
Plate B-1
Structural
Imbalances in the Economy: Canada's GDP vs. Royal Bank Domestic LoansThis Plate provides powerful evidence
corroborating:
- Significant structural
imbalances in Canada's economy: finance, insurance, and real estate have been favored
over industrialization (top row).
- Substantial overinvestments
and underinvestments vis-à-vis Canada's GDP (see bottom row and following Plate).
The contribution of finance,
insurance and real estate to Canada's GDP increased -- from 17% in 1966 to 22.79% in
1994; by contrast, the contribution of manufacturing decreased -- from 30.64% in
1969 to 25.61% in 1994. At the Royal Bank (Canada largest Bank), the share of total
domestic loans taken by mortgages, consumer installments, credit cards, and
financial institutions loans increased substantially -- from 41.69% in 1982 to 75.24%
in 1994; the share taken by manufacturing loans fell -- from a puny 3.73% in 1989
to a punier 2.37% in 1994. Data in decimal form.
Notes:
GDP percentages exclude contributions from community, business, and personal
services, and from government services.
GDP and Royal Bank data are not strictly comparable.
In its annual reports, the Royal Bank disaggregated manufacturing loans data,
spinning off new series; the disaggregations appear to have been triggered by increases in
non-accrual loans, in previously aggregated loan categories.
Sources:
Statistics Canada, Canadian Economic Observer, Historical Statistical Supplement
1994/1995, 1995, Catalogue 11-210, at 23-24 (GDP at factor cost, by industry, 1986
prices, Table 4).
Royal Bank annual reports (domestic loans by industry, net of specific and general
provisions, as at September 30).
[Copyright © 1998 by
MACROKNOW INC. All rights reserved.]
|
|
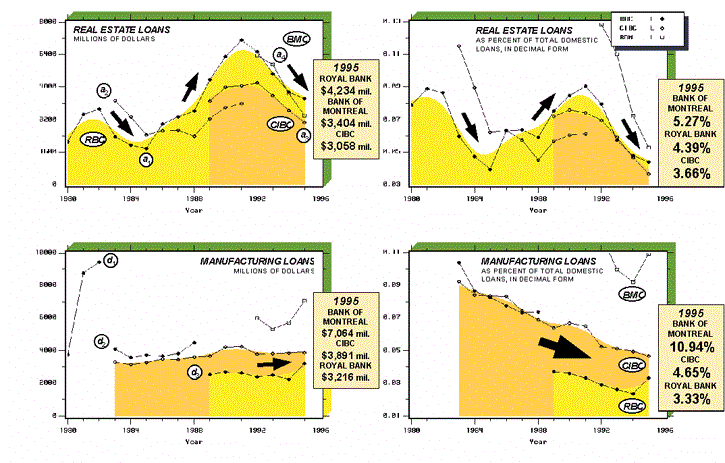
MISDIRECTED LOANS?
OVERINVESTMENTS
IN REAL ESTATE. UNDERINVESTMENTS IN MANUFACTURING. |

LEGEND |
Canada's top three banks |
| BMO |
Bank of
Montreal |
| CIBC |
Canadian
Imperial Bank of Commerce |
| RBC
|
Royal Bank
of Canada. |
| Loan
curves |
| a1 |
RBC
commercial real estate, 1980-1995 |
| a2 |
CIBC
construction and development, 1983-1991 |
| a3 |
CIBC real
estate, 1989-1995 |
| a4 |
BMO real
estate, 1992-1995. |
| d1 |
RBC
manufacturing, 1980-1982 |
| d2 |
RBC
manufacturing, 1983-1988 |
| d3 |
RBC
manufacturing, 1989-1995. |
|
|
Plate B-2
Misdirected
Loans? Overinvestments in Commercial Real Estate and Underinvestments in Manufacturing, at
Canada's Top Three Banks This and the previous Plate together
provide powerful evidence corroborating the existence, at Canada's top three banks of:
- Cyclical variations in
commercial real estate loans (top row). The duration of the last investment cycle
was about 10 years (see curve a1 ).
- Systematic underinvestments
in manufacturing (bottom row).
The extent of the economic
and social consequences from misdirected loans, and possible causes of overinvestments in
commercial real estate, are investigated in the following Appendixes. Loans in millions of
dollars; and loan percentages in decimal form.
Notes:
Data are not strictly comparable.
In annual reports: Royal Bank disaggregated manufacturing loans; and CIBC changed
its presentation of data for real estate loans. The disaggregations of RBC loans
appear to have been triggered by increases in non-accrual loans in previously aggregated
loan categories.
Sources:
Bank of Montreal annual reports (net loans and acceptances in Canada, excluding the
general provision, and diversified commercial loans, by industry, as at October 31).
CIBC annual reports (net loans before sectoral allowance and acceptances, as at October
31).
Royal Bank annual reports (domestic loans by industry, net of specific and general
provisions, as at September 30).
[Copyright © 1998 by
MACROKNOW INC. All rights reserved.]
|
|
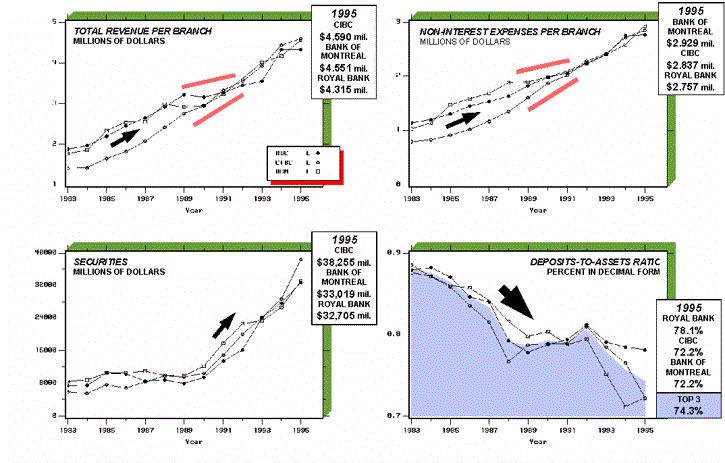
TACIT COLLUSION?
POWERFUL
EVIDENCE OF "CONSCIOUS PARALLELISM" AT CANADA'S TOP THREE BANKS |
|
Plate B-3
Evidence of
"Conscious Parallelism" at Canada's Top Three BanksThis Plate provides powerful evidence
corroborating "conscious parallelism" at Canada's largest three banks.
Signalling regarding prices (total revenue per branch) and costs
(non-interest expense per branch) appears to have increased significantly after 1989, the
onset of the "credit crunch" at Canada's top banks (see next Plate). Curves
derived from data in annual reports.
Sources: Bank of Montreal, CIBC, and Royal Bank annual reports (interest income, other
income, non-interest expenses, securities, deposits, assets; and total number of branches
or service delivery units, for years ended October 31).
[Copyright © 1998 by MACROKNOW INC. All rights reserved.]
|
|
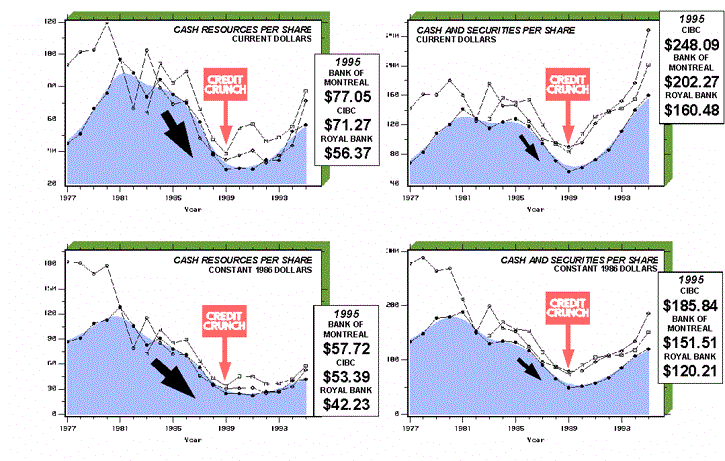
CREDIT CRUNCH AT CANADA'S TOP THREE
BANKS
THE
EMPIRICAL EVIDENCE |
|
Plate B-4
Evidence of a
"Credit Crunch" at Canada's Top Three Banks: Cash Resources and Cash and
Securities -- Per-Share, in Current and Constant (1986) Dollars, 1977-1995This Plate
provides powerful evidence corroborating the occurrence of a "credit crunch" at
Canada's top three banks, starting around 1989. The credit crunch was not limited to
Canada's top banks. The credit crunch at banks and trust companies can be linked to a
variety of factors, including misdirected loans (excessive overinvestments in commercial
real estate, and underinvestments in manufacturing and technology).
Cash resources per
share fell substantially in the 1980's:
- At the
Royal Bank, in constant 1986 dollars, by about 80.5% -- from $128.47 in 1981 to a low
$25.05 in 1989!
- At the
CIBC, by about 70.8% -- from $119.73 in 1980 to $35.01 in 1989!
In constant dollars, cash
per share remained essentially flat from 1989 through 1994. The combination of misdirected
loans (including overinvestments in commercial real estate) and the "credit
crunch," at banks and trust companies, played havoc with the National economy. For many small
businesses, the consequences were devastating. The extent of the devastations --
recession, excessive unemployment rates, economic destabilization, excessive bankruptcy
rates, excessive cumulation of government and personal debts, etc. -- is depicted in the
following Appendixes.
Sources: Bank of
Montreal, CIBC, and Royal Bank annual reports (cash resources and securities, as at
October 31); and Statistics Canada, Canadian Economic Observer, Historical Statistical
Supplement, 1994/1995, Catalogue 11-210, 1995, and Statistics Canada Inquiry Line (CPI
deflator).
[Copyright © 1998 by
MACROKNOW INC. All rights reserved.]
|
|

|


